
Mermaid Diagrams
Mermaid turns Blueprint graphs into flowchart diagrams that render in GitHub, GitLab, Notion, and many other tools, no screenshots needed.
What you get
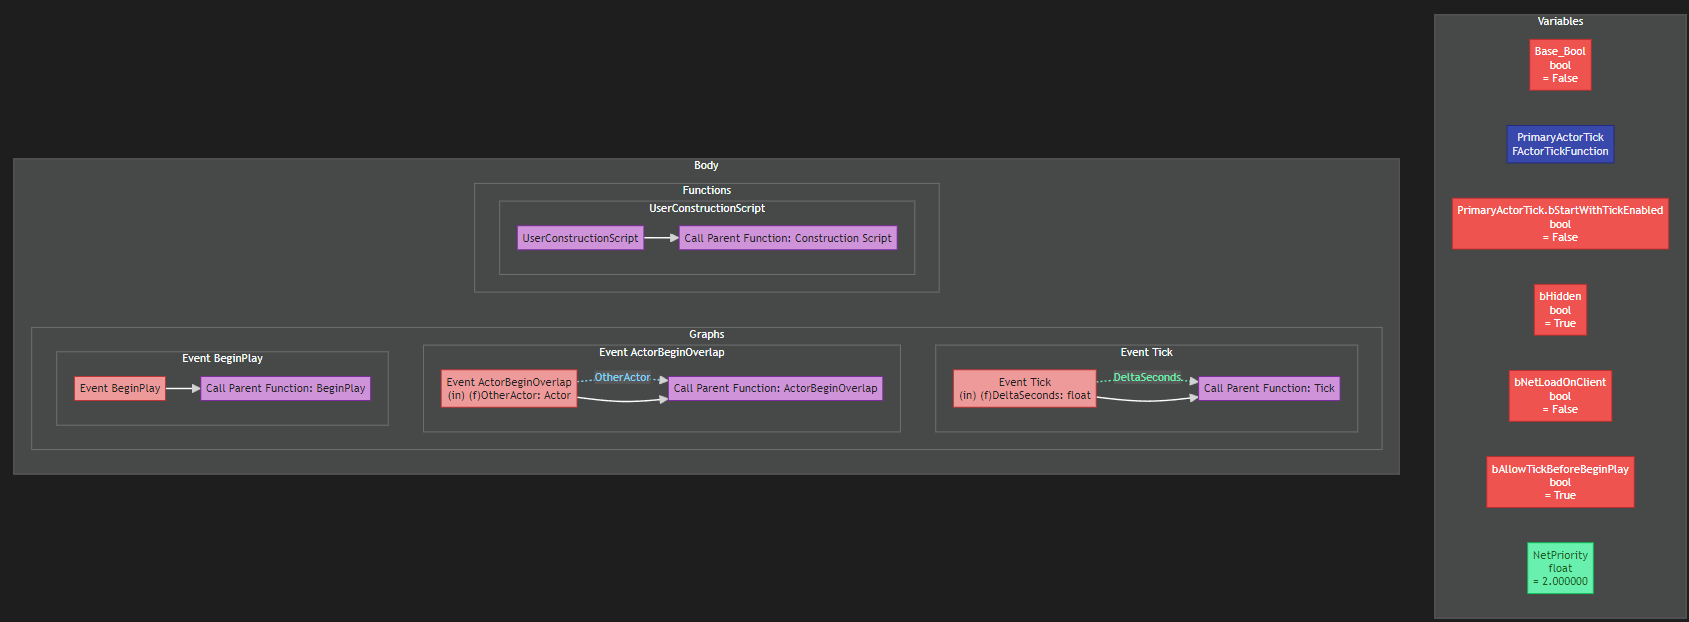
Exporting to Mermaid produces a .mmd file containing a flowchart TB diagram. Paste it into any Mermaid-rendering page (or mermaid.live) and it becomes a visual flowchart of your graph.
The diagram is structured in three areas:
- a Variables subgraph (
SG_VARS), one node per variable, labeledName<br/>Type<br/>= value, - a Body subgraph (
SG_BODY) holding a Functions subgraph (SG_FUNCS) and a Graphs subgraph (SG_GRAPHS), - node colors via
classDefs (event/call/struct/switch...) and variable-type colors (v_bool,v_float, ...) assigned withclassstatements.
A condensed real export (from the example content shipped with the plugin, DA_Test.mmd, a DataAsset with no graphs, so the body shows the empty placeholders):
mermaid
%% DA_Test
%% Parent: PDA_BaseAsset_C
%% Layout: Variables (top) | Functions (left) | Graphs (right)
%% Soft node colors via classDef; exec edges white; data edges match variable type legend
flowchart TB
  subgraph SG_VARS["Variables"]
    direction LR
    VAR_Base_Bool["Base_Bool<br/>bool<br/>= True"]
    VAR_Base_String["Base_String<br/>FString<br/>= PDA_BaseString"]
    VAR_Base_Int["Base_Int<br/>int32<br/>= 12"]
  end
  subgraph SG_BODY["Body"]
    direction LR
    subgraph SG_FUNCS["Functions"]
      direction TB
      FN_EMPTY["(no function graphs)"]
    end
    subgraph SG_GRAPHS["Graphs"]
      direction TB
      GR_EMPTY["(no event graphs)"]
    end
  end
  classDef n_event fill:#ef9a9a,stroke:#c62828,color:#212121
  classDef v_float fill:#69f0ae,stroke:#00c853,color:#1b5e20
  %% ... (the full color table for node and variable classes)
  class VAR_Base_Bool v_bool
  class VAR_Base_String v_string
  class VAR_Base_Int v_int
For Blueprints with graphs, the body subgraphs contain the actual flow: exec edges between nodes (-->), labeled data edges (-.->), and the same color classes. Widget Blueprints add a SG_WIDGETS subgraph with the nested widget hierarchy, and Widget animations get an SG_ANIMS subgraph. Rendering the file on GitHub or mermaid.live gives you the diagram.
Where Mermaid renders
- GitHub, in READMEs, issues, and PRs via
```mermaidfenced blocks - GitLab, same syntax, same result
- Notion, pasted Mermaid blocks
A note on readability
Large graphs get hard to read as diagrams. The export dialog warns you when a Mermaid export exceeds your configured Mermaid Warn Node Count and suggests Markdown. For reading the details of a graph (pin values, defaults, exact calls), use the Markdown output instead it's more precise. Think of Mermaid as the picture and Markdown as the spec.